Math + facts = suck
2020-07-09
In the last post I did some basic arithmetic to see if the system as designed should be able to measure 110F. This post is about verifying the physical reality to see if matches the pristine mathematical theory.
To turn the VICTD into temperature in Kelvin the function is below. We know this from the previous post.
$$T_K = V_{ICTD} \times 10^3 $$
Measuring the output of the probe I get a reading of 0.30111V. Thus \(T_K = 0.30111 \times 10^3 = 301.11K \). According to Google 301.11K = 82.328F. Little high, but believable. I had a trusted, but not calibrated, RTD thermometer physically in contact with the ICTD probe and it was reading 78.9F for a difference of 3.428F. That’s not really great.
Lets go back to the original function where we established relationship between load resistance and Kelvin values for an ICTD probe and make it more generic.
$$ V_{ICTD} = \frac{T_K}{10^6} \times R_{load} $$
We can rearrange that formula to get resistance from a probe voltage (VICTD).
$$R_{load} = \frac{V_{ICTD}}{T_K}\times 10^6$$
If we plug the values in \(R_{load} = \frac{0.30111}{301.11} \times 10^6 = 1000 \). That’s dead nuts on the 1K 0.1% resistor that’s specified in the design. So what gives. Several possibilities:
- My reference thermometer is out of whack from bouncing around in the back of a service truck
- My math is wrong
- My logic faulty
- Nothing is actually wrong
Lets hand-wave away 1-3, I’m never wrong. So we’re left with #4 – nothing is actually wrong. Looking at the AD590 datasheet, we see that their “worst” model, the AD590J is \(\pm 5K (9R) \) at 5V and 25C. Their next better model, the AD590K is \(\pm2.5K (4.5R) \). I have no way of knowing what kind of IC the probes are using, but my professional guess is that they’re not using the pricier AD590 models. Since these facts fit my current line of though I’m going to go ahead and assume that my guesses reflect reality.
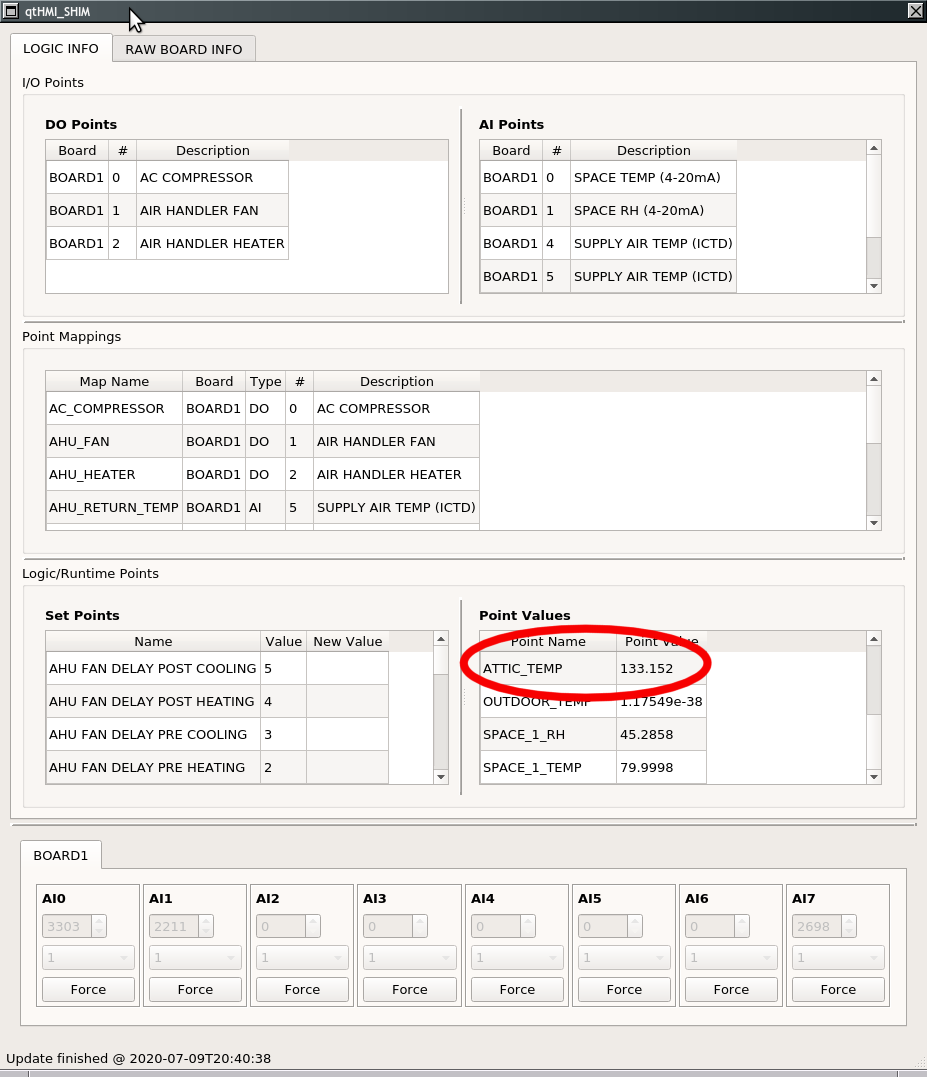
Can we physically verify that the probe can read above 110F? That’s an excellent question and the answer is of course yes. Below is a screenshot of the debugging tool qtHMI_SHIM and the highlighted value is the same type of sensor that’s in the attic. The hardware is a test rig, but it’s identical to production hardware. I heated the probe with a hot air gun.
So what gives then. Why do we have goofy looking data like below. I would expect the attic temperature to track the ambient temperature, but that’s simply not the case. Strange.
bbb_hvac=> select time_stamp, attic_temp, outdoor_temp from data.home_data where outdoor_temp = (select max(outdoor_temp) from data.home_data);
time_stamp | attic_temp | outdoor_temp
----------------------------+------------+--------------
2020-07-09 15:00:14.858385 | 105.467 | 97.2472
(1 row)
bbb_hvac=> select time_stamp, attic_temp, outdoor_temp from data.home_data where attic_temp = (select max(attic_temp) from data.home_data);
time_stamp | attic_temp | outdoor_temp
----------------------------+------------+--------------
2020-06-19 17:13:16.62298 | 110.96 | 90.6096
2020-06-19 17:15:35.437005 | 110.96 | 90.4379
2020-06-19 17:15:47.08112 | 110.96 | 90.4951
2020-06-19 17:11:41.415881 | 110.96 | 90.4379
2020-06-19 17:18:08.274933 | 110.96 | 90.2663
2020-06-19 17:13:38.094907 | 110.96 | 90.3235
2020-06-19 17:13:44.237102 | 110.96 | 90.4951
2020-06-19 17:13:45.297166 | 110.96 | 90.4951
2020-06-19 17:20:27.016029 | 110.96 | 90.4379
(9 rows)