2020-03-29
2020-03-30
I have been working on integrating the grossly over-designed and needlessly complicated thermostat into the house. It has been mounted in the data closet (see here) and connected to the home network. All critical sensors and some of the optional sensors have been been installed. Of the optional sensors the attic temperature and the AHU supply air temp sensors have been installed. More on that later. The system is not yet controlling the house AC as I’m in the process of squashing the last few bugs in the software end of things. Nothing extra exciting. Just your basic run of the mill housekeeping problems. Details are on GitHub (see here). Another fun piece of software is the web front-end to the data that is being collected from the sensors.
So for funsies I have my home server polling the Beagle Bone (that is my thermostat) once a second and logging all sensor and operational data. The data from the attic temperature, AHU supply/return temperature, etc. sensors once correlated should provide insight into stuff. What kind of stuff I don’t know yet. Off the top of my head, I’d like to see what difference in the numbers new windows will make.
Coming back to the AHU supply air temperature sensor. It’s installed and calibrated and operational. And here is some of its data compared to space temperature.
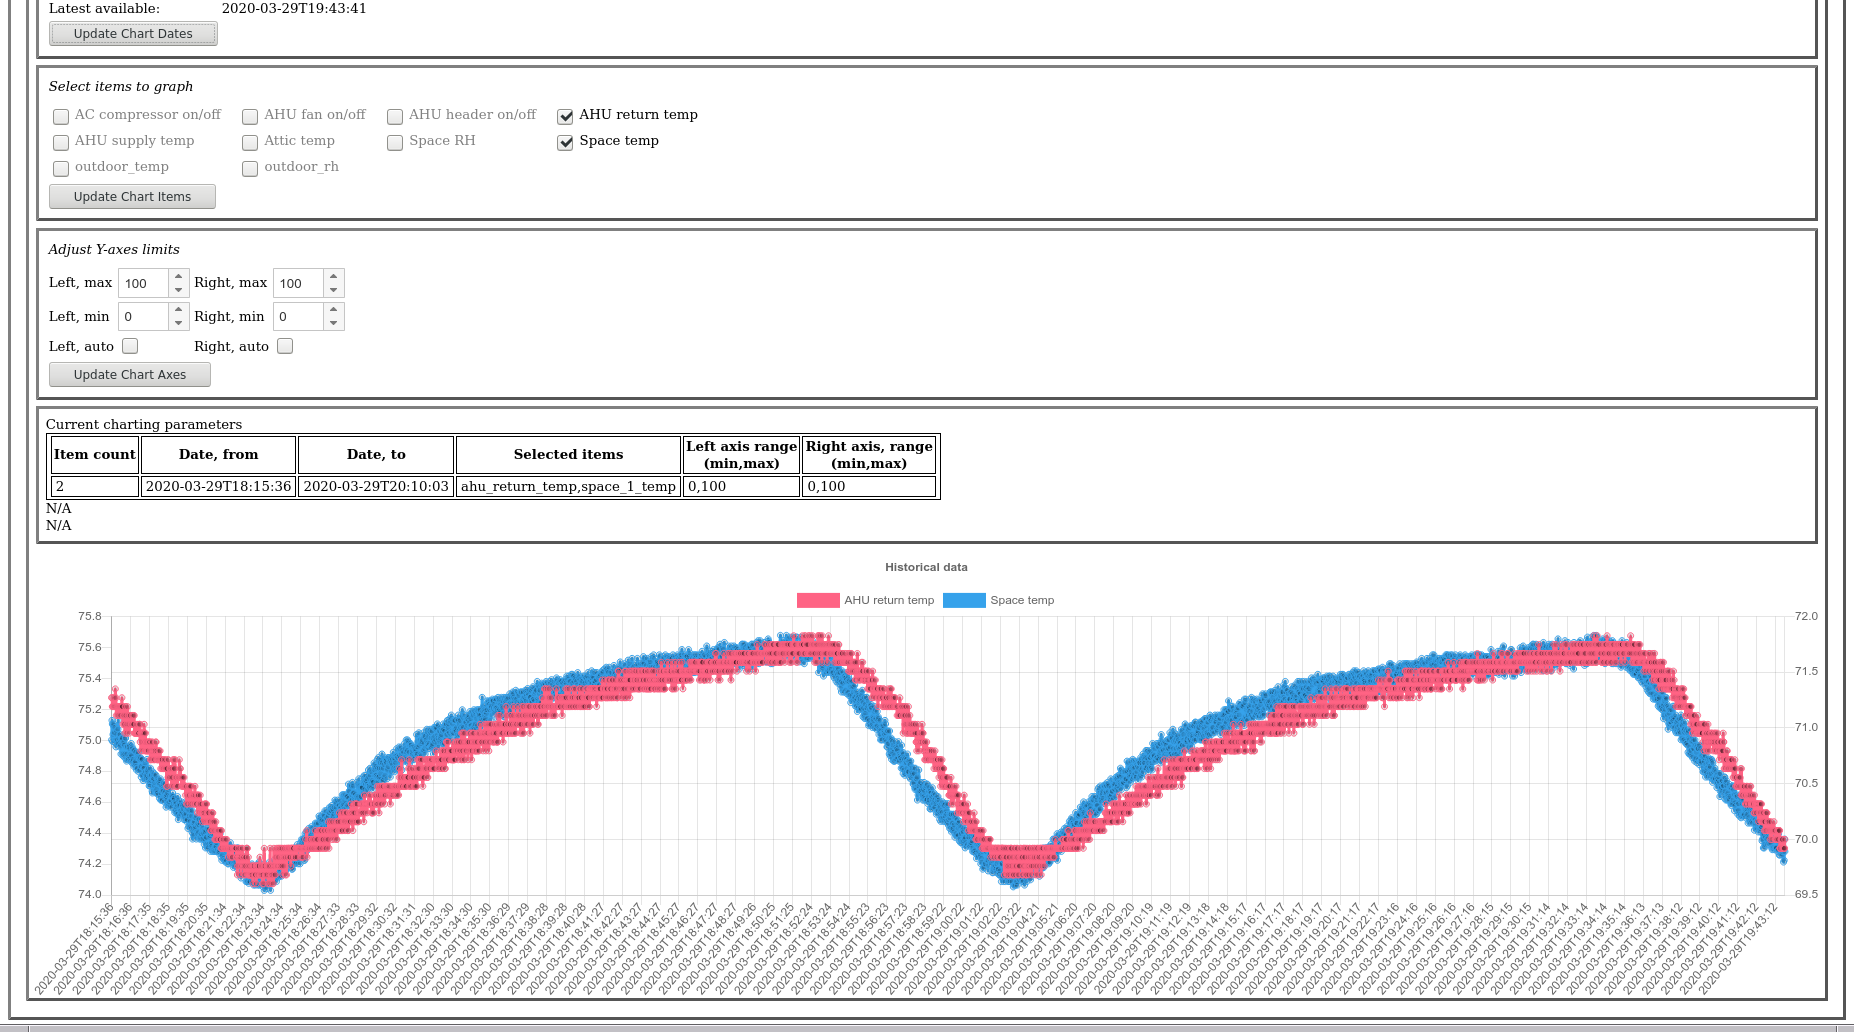
You should be able to click on the image for to embiggen it. So red is AHU supply temp (yes I know it’s mislabeled) and blue is the space temp. The x-axis is time from 18:15 and 19:43 or approximately an hour and the y-axis is the temperature. We can see several very interesting things. And these are hand-grenade approximations
- A cooling cycle (time between the AC system turns on and then back off again) takes approximate 11 minutes.
- The off cycle, or when the heat is infiltrating the structure, is approximately 32 minutes.
- Oddly initially the interior space heats up at a greater rate than the interior of the AHU supply duct. This could be explained by difference in probe mass. The duct mounted probe is a stainless steel tube while the interior space probe is a sensor on a PCB.
- There is a fairly close relationship between the space temp and the AHU duct temp. Because my AHU is in the attic I expected the duct temperature to rise well above the space temperature.
- The data looks similar but noticably different. Could be an electric issue since the two types of analog inputs are different. Or perhaps an issue of resolution Or it could be a bozo no-no. Need to investigate.
There are also a few bozo no-nos

- First and foremost it’s a glaring example of Wall Street Graphing. The vertical range of the graph is something like two degrees R and any change is grossly exaggerated.
- The two graphs belong to two different y-axes and each y-axis has a different scale.
- The two y-axes are scaled differently, but closely enough to where unless the reader pays deliberate attention they’ll probably miss the difference.
So some areas to investigate. Couple house keeping issues to address. The march towards ultimate truth continues.